How much and what do Pakistani customers consume? Is there an easy-to-reference breakdown of national consumption using retail, wholesale, and trade basket datasets? If we were to estimate Total Addressable Market (TAM) items sold most via retail channels in Pakistan, which items would make it to that list? What would be our estimates for their retail TAM in Pakistan using FY 2021 datasets? The answer depends on the channels we use for our analysis.
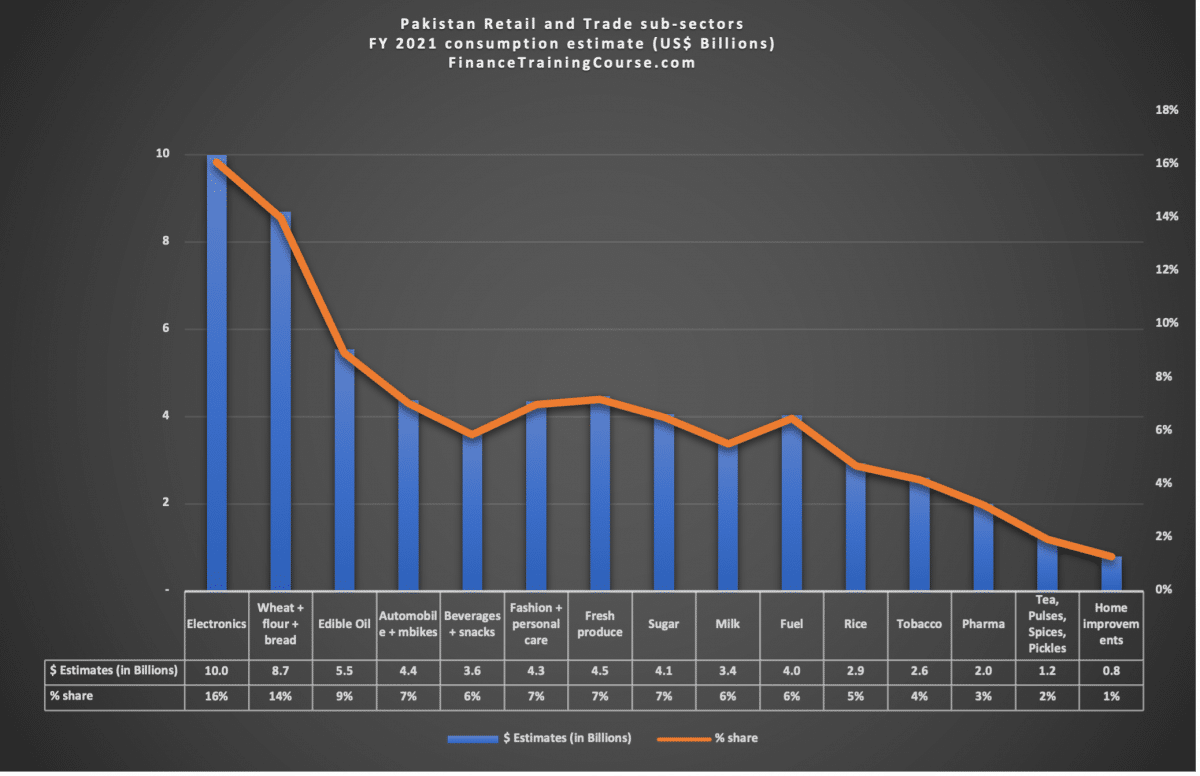
For formal (organized) retail in Pakistan top 5 categories include:
- Consumer electronics (TAM – $10 billion)
- Wheat flour and bread products (TAM – $8.7 billion)
- Edible oil (TAM – $5.5 billion)
- Retail fuel (TAM – $4 billion)
- Sugar (TAM – $4 billion)
For informal (undocumented) retail in Pakistan top 4 categories include:
- Wheat flour and bread products (TAM – $8.7 billion)
- Fresh produce (TAM – $4.5 billion)
- Fashion (TAM – $4 billion)
- Milk (TAM – $3 billion)
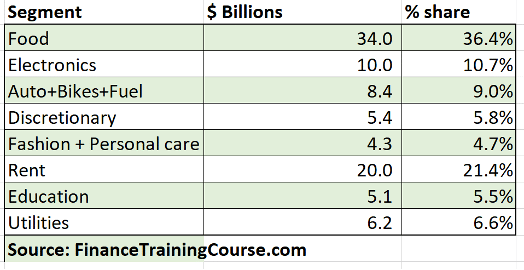
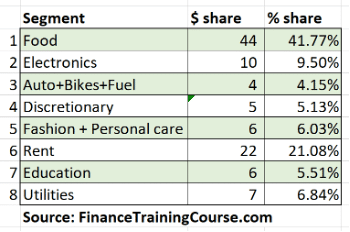
From a household expenditure basket lens the breakdown below shows the biggest expense heads as food, rent, consumer electronics, transportation, and mobility. Together they represent 77.5% of monthly household expenditure in Pakistan.
What is the source of these figures? How did we dig out and tabulate the numbers above? What is our comfort level with the accuracy of the estimated Total Addressable Market? Educated guesswork or a shot in the dark? How can we improve their accuracy and relevance? What would these figures look like after we make these adjustments?
The approach is simple, but the implementation is tedious. Here is the model we have followed for our estimates.
- For each category estimate the level of annualized yield, production, or imports (a).
- Apply a conversion factor to translate how the answer in (a) gets translated to product on retail shelves or channels (b).
- Apply retail market prices (c) to volumes generated by (b) to arrive at retail sector TAM (d).
- Cross check and validate (d) against trends in household consumption (e) and GDP (f).
The table below shows the model estimates for the total addressable market size for wheat, sugar, and rice for Pakistan’s retail market.
| Wheat (in tons) | Sugar (in tons) | Rice (in tons) | |
| Domestic Production | 27,000,000 | 6,750,000 | 7,600,000 |
| Total Import | 2,000,000 | 0 | 0 |
| Total Export | – | 0 | 4,000,000 |
| Net Domestic Stock (a) | 29,000,000 | 6,750,000 | 3,600,000 |
| Conversion Factor | 60% | 87% | 1 |
| Net Stock Used (b) | 17,400,000 | 5,872,500 | 3,600,000.0 |
| Unit Price (PKR/kg) (c) | 80 | 110 | 130 |
| USD:PKR Exchange rate | 160 | 160 | 160 |
| Total TAM (PKR) (d) | 1,392,000,000,000 | 645,975,000,000 | 468,000,000,000 |
| Total TAM (US$) | 8,700,000,000 | 4,037,343,750 | 2,925,000,000 |
In our earlier article on Pakistan’s retail and trade market sizing exercise, we looked at a top-down approach to estimating and sizing markets. We use an extension of the same top-down model to calculate the total addressable market (TAM) for the entire retail segment, sub-segment by sub-segment.
Estimating Total Addressable Market (TAM). Motivation
This is an important exercise that serves two goals.
- One, it gives us visibility on structure of the retail basket. What do we buy more as consumers?
- Two, it gives us a chance to validate our top-down number with a second approach. Remember the guiding principle, two paths to the same answer.
Ask yourself a simple question. What sells more in Pakistan? Cigarettes, soft drinks, milk, cleaning supplies, edible oil, or motorbikes?
How would you go about answering this?
You could guess the answer is milk and edible oil. Once bare necessities are taken care of cigarettes (vices) beat beverages (discretionary), motorbikes (mobility), and cleaning supplies (hygiene). But how would you confirm the right answer?
The first challenge is access and availability of current information at the line-item level. Most industry associations do not report numbers. We do have good data to work with when big players are listed and traded on public exchanges. But we are not this lucky with all segments. Despite our reservations with lazy data, this exercise often boils down to guesswork and assumptions.
Consistency and clarity in reporting figures is a question mark but it may help with putting the first estimate out there in the open. Once that first estimate is out there, we could crowdsource expertise and refine our original answer.
Why bother? Why not take reported numbers and figures at face value? Why waste precious time, bandwidth, and resources gathering data, running numbers, figuring strategy, when you could be out there capturing market share.
Hard data is the lifeblood of all businesses. As investors and founders, before we commit a decade or more of our life to an idea, it would be prudent to double-check and re-confirm the size of our ultimate payoff. Don’t bring a knife to a gunfight or a tank to a short sprint.
Tools, teams, and resources we need are a function of the markets we compete for. Not just in size but in also growth, competition, and structure. Good data lays that out and brings transparency and visibility to our game. Without good data, we fly blind.
Estimating retail and trade market size, sector by sector. The framework
There are three guiding principles in our Total Addressable Market estimation framework. The first is based on mindset and is common to work we do, the next two are based on mathematical relationships.
First. Improve estimates over time, collaboration, and input. Our objective is to not get to an answer accurate to the nth degree. We want to present a framework that we think would be a good starting point and can be improved upon. This is our mindset. Iterative improvement in estimates by refining questions and answers with each new iteration. When we put a number out there in the open, we make it possible for professionals with real data to come forward and fill in the holes in our analysis. In our estimates for fashion, cigarettes, and edible oil were revised based on feedback received in private from industry insiders after an initial draft of our analysis was shared on Twitter.
Second. We can’t consume or purchase more than what we produce or import. Some product storage (leftover balances from prior years) also comes into play. With wheat, rice, and sugar bumper crops may not be consumed the same and may be stored for export or consumption in later years. Storage can balance out over years with stable and consistent demand. It is not an input in our model but it is important to acknowledge its existence.
Where import, yield, or production data was available, we used imported volume and retail market prices to estimate the size of the market.
Third. Household consumption. Household consumption patterns were used as our balancing equation. Households spend on rent, fuel, food, mobility, communication, home maintenance, education, clothing, and then travel and entertainment. Trends and relative weights change as the standard of living improves. With accurate estimates for the biggest items in that equation, we can fill in the blanks for the rest. Once again PBS comes to our assistance. We look at two separate datasets on the composition of household expenditures in Pakistan. The 1998-99 household expenditure survey results for urban Pakistan and 2018-19 Household Income and Expenditure Survey (HIES) results also for urban Pakistan to round out our analysis.
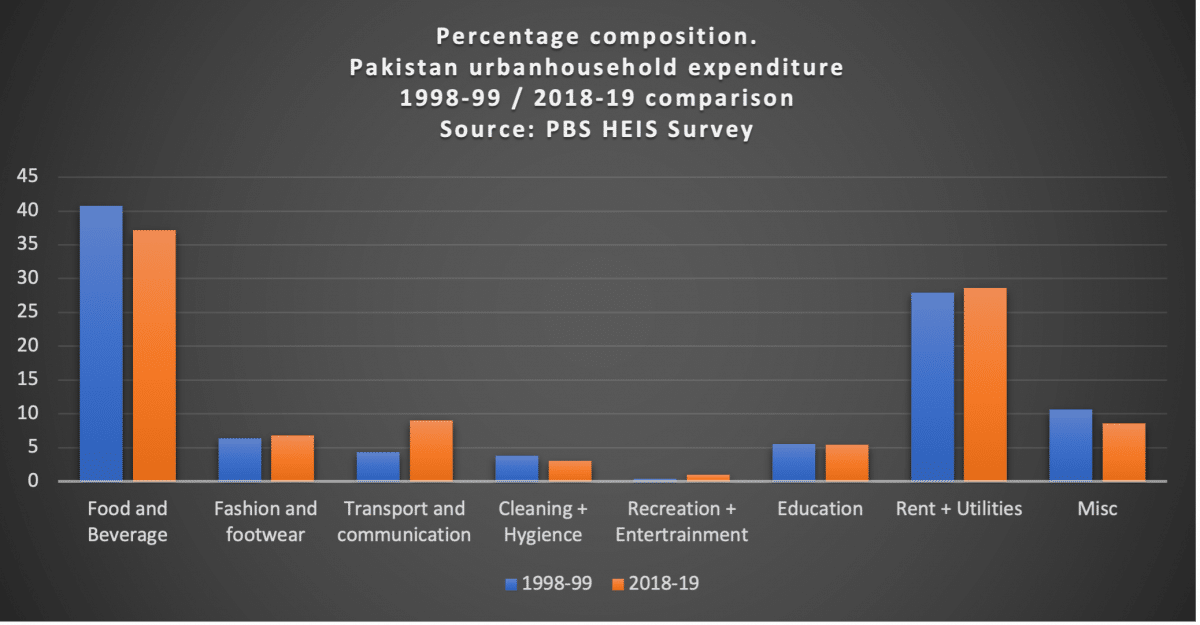
The two surveys provide the basis for validating estimates of retail consumer basket composition. They provide estimates for the missing rent and utilities bucket.
This is not a perfect approach but with missing data, it is a good starting point. As we understand the retail market better and find accurate data, we can come back and improve our estimates.
There is a fourth and final piece that deals with accurately estimating the impact of the informal, undocumented sector on estimates. We take a stab in some segments where we have data. But we won’t cover all of the informal sector and its contribution to the retail basket today.
If you have better data from primary sources with reference that you can cite and are willing to share, please do. If there is an issue with the approach we have taken for a specific sub-category and you have a better design, please point it out. Better data is not just good for one startup, it is good for the entire ecosystem. Anything we can do to help size our markets better will only make our rocket ship go higher and faster.
The retail TAM model deconstructed.
Our estimate for national retail sales or consumption for each category depends on the type of data available to us. There are five categories.
One. Mostly imported commodities. Tea is a great example. We know how much tea is imported from where and we have an average retail price that we can apply to get gross sales for tea. There is some loss, adjustments, or blending that happens in the packaging stage but given the magnitude of numbers for other categories, we can ignore these errors. The same principles work for pulses, edible oil, and other imported commodities that are imported in bulk and then packaged and sold to retail consumers in Pakistan. For edible oil, we make an adjustment for sales made to industrial customers versus retail customers and that is reflected in our final result.
Two. Agricultural output. For rice, wheat, and sugar we have agricultural production figures as well as the amount imported due to yearly shortfalls. Rice, wheat, and sugar are tricky because different amounts are retained for grower (farmer) and local consumption, export, and storage. But we can plug these proportions in as input parameters for now in our model. Milk is trickier because the market has two clear segments. Fresh over the counter (informal sector) and pasteurized (formal sector). We have estimates for the formal sector but have limited visibility to milk sold via the informal sector. We use a mixed model taking elements from both for our milk retail estimate.
Three. Manufactured and processed goods. For other categories, petroleum products, automobile, and motorbike sales, consumer electronics, we can look at published financial statements of market leaders and estimate the overall market size. It won’t be an exact match, but it should be enough to get to a comfortable estimate. Some categories are easier than others because there is a listed market share leader and can be used to size the overall market.
For instance, petroleum products. Pakistan State Oil (PSO), the state-owned OMC publishes annualized sales of petrol (Motor vehicle Gas or MoGas) and High-Speed Diesel (HSD) in metric tons. We can convert that into liters and apply the average pump price to estimate the volume of retail sales. While petrol is straightforward, HSD is complicated because PSO has corporate relationships where they supply HSD in bulk to corporate clients for use within logistics networks or for power generation. Unfortunately, within PSO’s financials and notes to financial statements, there isn’t a detailed breakdown of fuel sales to business customers or separate reporting for that line of business.
But it is not just PSO. Business segment reporting in Pakistan even for publicly listed entities is not at the same level of disclosure we would expect to see in more developed markets. Business segment breakdown is not at the right level of detail in notes to the financial statements. We will run into the same problem with milk and beverages, segment later.
For automobile and motorbike sales (also included in retail and trade category) we look at revenue figures for Toyota Indus, Pak Suzuki, Honda Atlas, and Honda Cars to get an estimate of market size. Our estimate is a little dated and lagged and doesn’t include the arrival of Kia and Lucky motors but that can be fixed easily in the next iteration. It also excludes the imported after part market which is significant with respect to the auto sector but not big enough compared to other retail segments. Garages and repair workshops are excluded from the definition of retail category as per the PBS classification guide.
Four. Limited or partial data availability. The fourth and final category is limited or partial data category where we only have limited visibility into the sector. For instance, fashion has four sub-categories. Fabric, cosmetics, footwear, and accessories. Of the four, only footwear has reliable quality publicly available data mainly because Bata and Servis Shoes are listed entities and the industry association had stated local manufacturing capacity a few times. For fashion fabric, we used industry sources and veterans to make educated guesses about local consumptions and sales, but we would be hard-pressed to find reliable documentation on those figures. The same holds true for cosmetics and accessories.
Spices, recipe mixes, soups, and kitchen supplies are another interesting segment with partial data and visibility. The leading player in this space, National Foods is listed. Others are not. Industry studies hint towards National Foods overall market share and we can use that to build an estimate for total market share. It’s a small segment but the modeling approach is very similar to the one we have used with PSO. Take total sales of the leader, divide by the market share of the leader to estimate total market share. The only difference is the credibility and weight attached to our estimate for total market size for both these segments.
Five. No publicly available corroborated data set. Not added or included in the list. Used as a balancing item. This category is the hardest to estimate and often will be part of the informal sector. Fresh produce, fruits, vegetable, poultry, meats, seafood, and proteins are immediate examples. Fashion fabrics and shoes are a second good example. We use urban consumption models to come up with the first estimate in this category. While this is guesswork, we use prior work done in estimating the size of the urban middle class in Pakistan to model fresh produce and protein consumption in urban centers and use that as a basis for our market size.
Total Addressable Market methodology. Qualifications and shortcomings.
Divide and conquer is the oldest trick in our bag as an analyst. Face a big problem with multiple moving parts? Solve for a single small component first, then repeat the process for the next one. That is the approach we have used.
Let’s start with definitions. What qualifies as retail in the data on retail? When we think retail what comes to our mind? Fashion, cosmetics, groceries, cleaning supplies, consumer electronics, cooking mixes, spices, herbs, fresh produce, and milk.
What about retail fuel, automobile and motorbikes, pan, paint, pharma, and tobacco? Are they included in the definition of retail and wholesale trade category? Turns out we need to check the source to find out if they are or not. Since our data come via the Pakistan Bureau of Statistics (PBS) we need to look at their metadata to confirm the inclusion or exclusion of any element. The source is PBS economic activity industry classification document which tells us that they are.
In terms of filters where possible we clubbed items where annual exposure is less than $300 million into a more inclusive category. Sometimes categories have been defined by existing mappings in the underlying dataset. In other instances, they have been defined by the nature of the expense or the source data used to estimate their Total Addressable Market.
The reported retail and wholesale trade category include formal sector retail and trade figures for the above and more sub-categories. The formal sector represents the documented sector. Businesses that are not registered, small mobile pushcarts (thelay) owners, and informal (not organized, registered, or documented) players are not covered by formal sector surveys and studies.
The informal sector is a question mark. It is a part of the economy and can’t be ignored. During our work, there are instances where we used proxies and educated guesswork to estimate the contribution of the informal sector. For instance, proxies are accurate enough to give respectable results. In others, they are at best-educated guesses in the absence of data. Where possible we have indicated our level of comfort with source data, model or approach followed for estimating the Total Addressable Market.
Putting it all together. Validation and cross checks.
We already have the total retail and trade sector Total Addressable Market estimate from PBS break down of GDP for the fiscal year 2021. That number can serve as a cross-check on our drill-down estimates and calculations. The sum of our ballpark estimates should add up to our topline estimate (100%).
Under normal operating conditions this requirement should hold. An interesting development that occurred towards the end of our Total Addressable Market estimation exercise was rebasing of Pakistan’s GDP from 2005 constant dollars to 2015-16 constant dollars. The rebasing exercise increased national GDP estimates to $347 billion dollars. The size of the retail sector in our earlier exercise was estimated using GDP estimates of $286 billion. This revision gives us room for increasing not just the overall size of the retail sector but also the size of individual sub-categories within it. The impact of rebasing exercise is not fully reflected in our current model but is likely to shift our estimates higher.
As mentioned earlier for household expenditure we have used PBS expenditure surveys. One objective of our exercise was to size the urban household grocery market. Primary urban household consumption is linked to food, rent, mobility, and utility bills. The monthly grocery list can be broken down into:
- Perishable (fresh) include: Meat. Poultry. Milk. Fresh fruits and vegetables.
- Non-perishable (storage worthy) categories. Storage worthy categories include: Rice. Flour. Sugar. Tea. Pulses. Edible oil. Spices and herbs.
We use the PBS survey to add rent, utilities, entertainment, and other discretionary expenses to the basket. However, please note that our analysis is focused primarily on the size and structure of the retail basket. We have not done any groundwork or analysis on purchasing power, poverty, savings, upward mobility, or spending patterns in urban, peri-urban, or rural markets. The analysis performed here is not qualified to evaluate or answer these questions. While we perform a superficial analysis on comparing how household expenditure has changed over twenty years by comparing results from the 1998-99 and 2018-19 surveys, the analysis is superficial in nature and is only provided for education and illustration purposes.
Adjustments for informal sector
While we may not be able to make adjustments for the entire informal sector, we can make some educated guesses.
- We know in fashion fabrics, informal sector is twice as large as formal sector. If domestic formal fabric sales run to one billon dollars, informal fabric sales should be worth $2 billion.
- With milk our estimate for retail informal sales runs between $3 – $5 billion. Roughly twice the size of the formal packaged, pasteurized and processed milk market.
- With wheat and bread our model has room for another $3 billion based on wheat output that we did not include within the formal sector.
- For fresh produce informal sector estimate could be just as high as our current formal sector estimate.
- For home improvements, it is reasonable to add 600 million to a billion for contribution of informal sector.
With these 5 adjustments, we add $13 billion to the size of the total retail market under fashion, food, and home improvement sectors.
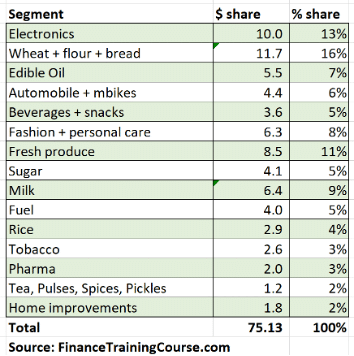
Here is the final break down of retail sub-sectors after the adjustments for informal sector.
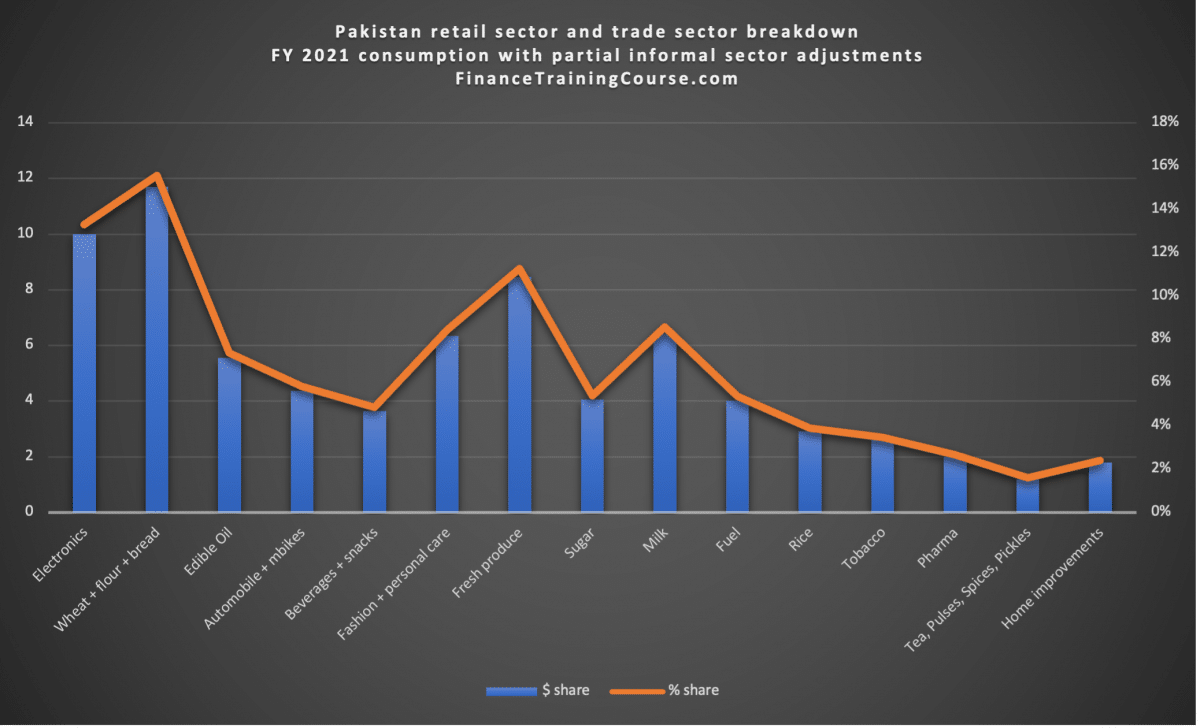
As well as the relative share of each sector within household expenditure for urban Pakistan.
Conclusion
Six weeks earlier we started with a simple query. Is there a snapshot of the retail sector that we can use for a client business plan? The answer was no. Six weeks later we have a first pass on the answer.
From an academic and research point of view, our methodology is neither robust nor rigorous enough to be defended. But it is a good enough working estimate to start a conversation. Our objective is to put this data and analysis out there is to start more conversations, just so we have better estimates produced and provided by more qualified, educated and smarter teams in a template and format that founders can use across Pakistan.
Please do your own diligence on these numbers and results. We would love to hear back from you on any issues, problems, challenges, or questions you find.
Sources and methods
Household expenditure
PBS household expenditure survey from 1998-99 and 2018-19. Urban Pakistan only.
- https://www.pbs.gov.pk/sites/default/files/other/yearbook2012/Social%20and%20Cullture/19-18.pdf
- https://www.pbs.gov.pk/sites/default/files//pslm/publications/hies2018-19/TABLE_11.pdf
Total Addressable Market Estimates by Category
With partial adjustments made in selected segments for informal sector contribution
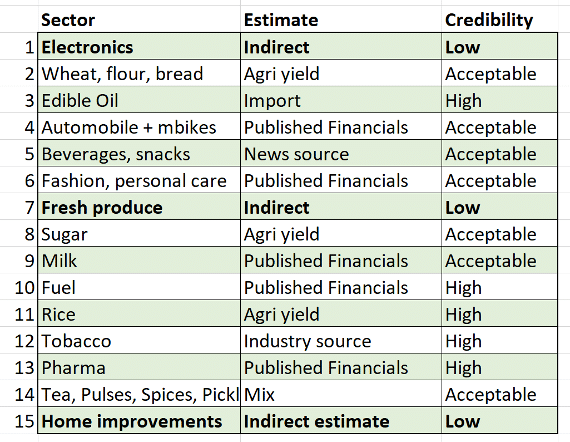
A summarized view of methods, model, and associated internal credibility ranking of our Total Addressable Market estimates.
We estimate market size in PKR term and then convert that into US$ using the average USD: PKR exchange applicable for the year. For the 2020-21 fiscal year, we have used 1 USD = 160 PKR for converting PKR values into USD estimates.
Wheat, flour, and bread products.
We assume total wheat production is converted into flour and bread products for distribution across retail channels. Estimation Model. Production + Import – (wastage, storage, and grower usage).
We converted wheat flour into a retail dollar value by using retail prices for wheat flour. This does not capture the impact of value addition by the bakery, snacks, and confectionery segment. If we make the adjustment the wheat estimate is likely to be lower. We used the lower end of forecasted values from our model ranges for this reason.
Sources:
- https://apps.fas.usda.gov/newgainapi/api/Report/DownloadReportByFileName?fileName=Grain%20and%20Feed%20Annual_Islamabad_Pakistan_04-01-2021
- https://www.dawn.com/news/1633447
Edible Oil
We assumed 50% of imported palm oil is Palm Olein and is used by industrial consumers in fast-moving consumer goods sector. The rest of edible oil imports are refined, packaged, and sold via retail channels.
Source:
- https://apps.fas.usda.gov/newgainapi/api/Report/DownloadReportByFileName?fileName=Oilseeds%20and%20Products%20Annual_Islamabad_Pakistan_04-01-2021.pdf
- http://sajms.iurc.edu.pk/issues/2014a/Spring2014V8N1P1.pdf
- https://www.pbs.gov.pk/sites/default/files//tables/rename-as-per-table-type/14.03_0.pdf
Sugar
Same model and data sources as wheat and bread products. Production converted into retail dollars using retail prices.
Source:
Pulses and Tea
Same model and sources (import data) as edible oil.
Fashion (Fabric, Footwear, Cosmetics)
Industry veterans estimates for domestic sales of top 8 fabric brands in Pakistan for fabric sales. For footwear extension of Bata and Servis shoe sales to estimate the domestic market size based on installed manufacturing capacity and average retail price less footwear exports. Cosmetics placeholder estimate based on the size of the first two segments. Maybe higher or lower This is for the formal sector only. No adjustments or estimates were made for the informal sector estimated to be twice the size of formal fabric sales.
Source:
Home improvements (Cement, paint, and hardware store sales)
Based on the total market size of cement and paint manufacturers adjusted upwards for other hardware products.
Source:
Other categories and segments
For Pharma estimated market size less exports. For retail petrol PSO annual report as a source for total market size. Assume MoGas sales as entirely retail. HSD mix of retail and corporate customers. For milk, Engro Foods and Nestle milk and dairy sales adjusted for the overall market size estimate shared in the Engro Foods report. Cigarettes and Tobacco sales are based on conversations with industry insiders. Estimate includes both formal and informal sector sales (corner pan shops). Auto industry data based on reported sales of Indus, Honda, Pak Suzuki adjusted upwards for market size. Auto figures exclude the impact of the aftersales parts market. Personal care and hygiene market size based on published financials of Colgate Palmolive adjusted upwards for Unilever, RB, and P&G Pakistan sales. Only a partial estimate since UL, RB, and P&G financials for most recent years were not available. Consumer electronics are based on unverified market research and intelligence report and are likely to be a low-quality estimate. Beverages, confectionery, and snacks markets estimates are sourced mostly from news stories in the absence of published financial data. Herb, spices, sauces, mixes, and kitchen supplies data is estimated mostly from the financial statements of National foods Foods grossed up for market size based on the relative share of Shan foods and other competitors in this space.
- https://nationalfoods.s3.ap-southeast-1.amazonaws.com/pdf/annual-report-2021.pdf
- https://www.nestle.pk/sites/g/files/pydnoa361/files/2021-04/Nestle-Annual-Report-Management-2020.pdf
- https://colgate.com.pk/wp-content/uploads/2021/08/Annual-Report-2021.pdf
- https://www.pbs.gov.pk/sites/default/files/other/PSIC_2010.pdf
- https://tribune.com.pk/story/2339672/rebasing-of-economy-pays-dividend-to-govt
- https://www.pbs.gov.pk/sites/default/files//tables/rename-as-per-table-type/Table_4.pdf