A common challenge with technology business founders is that we jump into founder/startup mode inspired by latest trends, breaking news or opportunities without running basic numbers.
It often starts with a desire to do something big in X (replace X with current flavor of the month), to not miss out on the next big wave, to try our luck together with an old friend, to leave our mark on the world, to make it to the front page of Wired, The Atlantic, Washington Post, Wall Street Journal, Financial Time or Forbes.
Founders often fall in love with ideas without thinking through the chain required to support and run a business. We need a framework that forces that one question:
If we won’t or can’t make money on a single order, how would we do so on a few thousand transactions?
We can’t fix a broken model by throwing cash at it or praying for divine intervention. If it costs us Rs.200 to acquire a customer that contributes Rs.50 to our margin (-150 net), we are going to run out of cash and capital very quickly. What may be considered a small negligible rounding error for a single transaction, may become a nightmare with one thousand orders.
Before we borrow oodles of cash from friends and family, spend money we don’t have on a pipe dream it is safer to run a simple Excel model that answers basic questions. For instance:
- What is the cost of serving one customer, delivering an order, funding an employee hour?
- How much does it cost to acquire new customers? (aka CAC or customer acquisition costs)
- What does a single order contribute to our bottom line? (aka CM or contribution margin)
- How frequently do customers return as repeat buyers? (aka retention rates)
- What is their order frequency? How frequently do they order? Why is this important?
- What are customers worth to a business over their lifetime? (aka LTV or customer lifetime value)
While these are not the only questions we should ask, they represent a good starting point.
Together they are often clubbed under unit economics. Unit economic is a filter that evaluates a business for profitablity at a unit transaction level. It looks at the business model from the perspective of a single customer and a single order, extends that perspective to points where a business could break even and then compares these metrics with competitors and their benchmarks.
This lens can examine profitability expressed via margins, orders volume needed to breakeven and cover costs and long-term growth potential.
While it is easy to fake these numbers via easily available online templates, experienced investors and partners can determine when a founder is trying to defend models that haven’t been thought through. It doesn’t take more than a few questions to unravel carefully weaved threads. The metrics are not just a test for business models but also founders.
How we fare with them determines if our business should survive, scale or be shut down.
Code is an expensive way to validate an idea (thank you Ali Nawab). Excel is cheaper and significantly faster than real life when it comes to doing a dry run on a business. We could figure out painful lessons with an afternoon of playing around with numbers without burning eight years of our life trying to work through variations of the same model. The three primary themes we play with are improve margins, increase orders or reduce costs. There are no other alternates.
We use Maya’s closet, a specialized growing online retailer, struggling with answering growth and scale questions to work through unit economics for startups. Can unit economics help advise our two young founders on how they grow their core business.
Maya’s closet
Altamash Murad vetted multiple new business ideas before he settled on Maya’s closet. Together with his partner and better half, Sabeen, he put together a concept that would solve a problem the two of them had struggled with for years.
As a young mother Sabeen disliked products on offer in stores for babies and pre-teen children. Why couldn’t we get an affordable range that came with choices of colors, style, sizes curated for with a reasonable sense of fashion. Just because babies couldn’t speak didn’t mean they should wear sacks packaged as clothes.
Welcome to Maya’s closet. An online store that sold and delivered affordable but quality baby and pre-teen clothing, gifts and accessories to mothers and families in Pakistan. While Altamash came up with the original concept and put together initial financing, Sabeen’s execution made the idea come to life.
Maya sourced inventory from textile manufacturers in China, Vietnam, Cambodia and Thailand. The edge was Sabeen’s eye and fashion sense in the selection process. Curated products picked by a Karachi mother, good enough for her children to wear, for mothers across Pakistan. Maya only put items on sale that were in stock in their warehouse, guaranteeing delivery within 48 hours to most cities in Pakistan.
When business started initially, Maya selected designs on vendor sites, paid for them in advance and shipped them to Karachi. In two years, as business grew, they were able to refine supplier relationship and get progressively better terms.
As of the writing of this note, Maya’s closet has been processing 30 orders a day, 800 orders a month (26 days in a month), 9,600 orders a year. Typical order size is Rs. 2,000. The site doesn’t do processing or deliveries on Sundays.
Maya has a pool of 19,000 customers that it has served over 24 months. 5,000 of these are returning customers who have placed multiple orders with the site.
Growth from one year to the next stands at 40% year on year and is likely to continue at this rate for the next few years. The primary restricting factor for the team is available working capital.
Altamash and Sabeen started the site with their own resources, borrowings from friends and family and working capital loans from a group of well-wishers. Since they run Maya as a lifestyle business, they never explored venture capital funding or growth capital to leverage their model.
The team runs a low-cost operation keeping fixed costs under Rs. 200,000 a month. They work from home, using their study as their primary warehouse and logistics control center, while keeping an eye on their two young kids.
Altamash runs a targeted Facebook and Google ad words marketing campaign every month. The campaigns are the primary source of leads for Maya. The campaign averages Rs. 150,000 a month in advertising expenses. Hosting cost for landing pages, shopping cart, payment consolidators and gateways, monthly support, Facebook page designs, product announcements, services charges to vendor and monthly support run an additional Rs. 25,000 a month. The two founders don’t draw a salary but distribute what is left at the end of the year after books and accounting is done.
Every year in November, Altamash and Sabeen sit down to plan for the next year at Maya. They focus on three areas of inquiry.
- How accurate is their pricing basis and does it need to be reviewed?
- Which elements of their business should they focus on to improve growth outlook?
- How much cash do they need to grow in the next projected sales cycle?
Let’s begin.
Unit economics for startups – Meet Maya.
We quickly go through the following calculations for Maya’s closet.
Break even and Contribution Margins (CM)
We already have some data from Maya on orders and order size. Average net margin on orders is 35%. With an average order size of 2,000, we have the first piece of our puzzle. Our initial crude estimate of Maya’s contribution margin per order is Rs 700 (35% of 2,000). When or if we refine our model this figure will change.
What does this mean?
This means that on an average order worth 2,000, goods being sold plus packaging, shipping and sales commissions cost Maya 1,300. After paying everyone who contributed to the sale including the vendor who provided the goods (900), the agent who sold the product (100) , the intern who packaged them (80), the courier who delivered them (220), Maya is left with 700 on every order.
This answers one of the questions on our list: what is the contribution of an average order to our bottom line?
Contribution margin = CM = 700.
Maya can use this 700 to offset indirect costs (not related to sales) such as rent, utilities, office consumables, administrative salaries and any other indirect expenses. Maya’s estimate for these expense items is 210,000 per month.
210,000/700 = 300 is the number of orders Maya needs to breakeven for a given month. If Maya books more than 300 orders a month, the operating expense of running the business are covered. If it doesn’t the founders will have to find external sources of funding to pay their bills and cover the gap.
Breakeven orders = 300
A higher margin (60% or 1200 per order) will lead to a lower breakeven point. A lower margin (20% or 400 per order) will lead to higher breakeven.
With 800 orders a month, Maya’s has grown beyond its breakeven point. From a validation point of view this is great news. Ignoring founder salaries, Maya is cash flow positive, generating enough in monthly margins to cover monthly expenses.
Given the size of the growing middle class in Pakistan, the regional fertility rate, there is a large addressable market of affluent young mothers that Maya can go after
Customer Acquisition Costs (CAC)
Maya spends 175,000 a month in online advertising to acquire 500 new orders from new customers. 50 – 100 orders are generated organically by the site by customers who find the site through organic search. 200 orders come from repeat customers – customers who have already purchased items from the site in the last two years.
Working only with the 500 new orders generated through Facebook and Google ad words campaigns, our cost per new customer works out to be:
Customer acquisition costs = CAC = 175,000 / 500 = 350
Maya is spending 350 to acquire new customers through this advertising channel. For now, we will ignore the cost of customers generated through organic search to keep our narrative simple. In an ideal setting you could calculate a blended cost between paid per click and organic search. You would need the cost of maintaining search engine results page rank every month and allocate that to the 50 – 100 customers generated by that channel.
We don’t have that data, but a blended rate is likely to be lower and would also result in slightly lower cost allocation to the advertising channel since some of costs associated with landing pages and site maintenance could be shared across two channels.
Lifetime value of a customer – LTV
How much are these customers worth? The ones Maya is paying 350 each to acquire.
To answer we take a step back and examine the persona of Maya’s typical customers.
Maya’s most common customer segment are young mothers under the age of 40 with two children, who have access to a smart phone or a personal computer, broad band internet and are active on Facebook. Like Sabeen these mothers have discerning tastes, enjoy shopping online and are quite conscious of price and relative value.
Mothers with school going children buy materials from Maya’s site twice a year at the start of each school term. In addition to clothing, they also pick up school accessories such as bags, water bottles and class aprons. Mothers or families with babies have a purchasing trend line that Sabeen understands because she is one. Two seasons and two sizes a year till the child hits school age. Then the model reverts to school going moms.
While Maya get orders from all over Pakistan, customers who place multiple orders, fit one of the two profiles listed above. Because Maya is interested in growing this specific segment, we look at lifetime value of these mothers for Maya.
Lifetime value is a proxy for projected income a customer is likely to generate for a business. It has the following key drivers.
Contribution Margin = 700 = represents value per order that a customer brings to a business
Customer Retention Rate = 30% = is the probability that a customer will place a 2nd order and will continue placing them through out her association with Maya
Orders per year = 2 = The frequency of orders for customers who are repeat buyers.
Customer life in years = 11 years = The number of years a customer is likely to buy from Maya after the first order is placed.
When we combine the four by multiplying them together, the answer gives us our magic number for lifetime value.
Lifetime Value of future orders = LTV = 700 + 700 * 30% * 2 * 11 = Rs.5,320
What does this mean?
This means that a new customer is likely to place an average of 2 orders a year for the next eleven years if Maya can convert her into a repeat buyer.
The first order is worth 700 in contribution margin. Subsequent orders are also worth the same amount as long as the customer converts into a repeat buyer. The probability of that happening is 30%. For simplicity we have modeled customer conversion as a single event with a single probability. In reality the model would assign different probabilities for each year.
On each of these orders, the customer would contribute Rs.700 in margin to Maya’s bottom line. Over eleven years, twenty orders and a retention rate of 30% this adds up to Rs.4,620 + 700 = 5,320 for the first order.
LTV for a brand new customer is therefor 5,320
The upper bound on this equation is a retention rate of 100% = 700+700 * 2 * 11 = 15,100. The lower bound a retention rate of 0% = 700 + 0 = 700
The correct answer lies somewhere in between.
A couple of quick qualifications.
The above estimate for LTV is a crude approximation because it doesn’t include time value of money and correct adjustments for different probability models for customer conversion.
The actual LTV calculation is more involved than the simplified version presented above. Using a detailed LTV formula results in lower LTV estimates. Especially for Maya because the impact of time value of money and probability impact really kicks in over a decade of association.
Despite the inaccuracy and the explicit error in our estimate, we will use it to keeps our narrative simple and to the point.
Applying unit economics

What do we do next with the three numbers we have just estimated for Maya’s closet? How can Altamash and Sabeen put them to work tomorrow morning?
Here is a simplistic frame of reference built around unit economics.
What you pay for your customers is your upfront investment.
Contribution margin is immediate return. Lifetime value is a bird in the bush. The size of the bird is dependent on the realization of your assumptions. While as founders we often feel that we can predict the future, our actual track record is quite poor.
LTV is long term return but like a conditional promise linked to our ability to retain the customer by keeping him or her happy, holding everything else constant.
Contribution Margin is tangible, immediate and solid like cash in bank. Compared to contribution margin on our first order, LTV is foggy, uncertain and likely to be overstated.
Maya’s contribution margin at 35% is reasonable but it could be better. Industry and competitive averages indicate that Maya can take it as high as 70% when it adds volumes and receives better terms from its suppliers and better prices from its customers on higher value and higher margin products.
Paying 350 to acquire a customer that generate 700 per order is not as exciting and needs to be improved. If Maya could figure out an increase in conversion yields and 350 comes down to 100, that would be a step in the right direction. Or if Maya could increase the average order size from 2,000 to 4,000, taking contribution margin from 700 to 1,400.
Refine ideas and models towards…
Lower CAC (acquisition costs) and higher CM (margins). We create value when CM is significantly greater than CAC. If we are paying 200 to acquire a customer who contributes a net margin of 2,000 per order, we are already ahead of the curve compared to 90% of all startups. If we are paying 200 to acquire customers who generate a net loss on every order, we need to find something else to do.
Aim for a CAC to LTV ratio of 6 or 9 or CM > 9 * CAC. If we aim for 6 or 9, we will end up with 4 or 5. Aim for 3, end up with 1.5. First time founders tend to undershoot and miss their targets by wide margins so aiming for higher CAC to LTV ratios is recommended.
At 5,320 to 350, Maya’s LTV to CAC ratio is over 15, which is very attractive. The correct value for LTV and the LTV to CAC ration using a more accurate formula is likely to be lower.
Aim for ideas that lead to a higher percentage of repeat buyers and customers. Ideally with increasing margins and retention rates, especially with repeat orders. Repeat buyers and customers are your path to sleeping peacefully at night with a full stomach.
Don’t look for new markets, open in new cities, add products line till you have done this and have the formula down pat. Founders often believe that new markets will solve old problems. They don’t, they make them worse. Mindless expansion with poor unit economics is a recipe for disaster, male pattern baldness, poor blood chemistry and poverty.
I speak from experience.
All else held equal a business with higher purchase frequency is better than one with lower frequency.
Higher frequency, higher margins, higher retention lead to higher LTV.
All customers are not created equal. Some customers are more equal than others. When you do your customer segmentation or persona analysis pay special attention to purchase frequency and the customer association arc with your business.
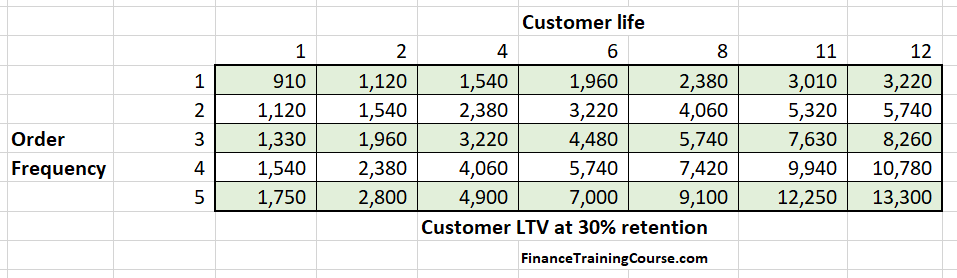
If it cost the same to acquire all customers, which of the above customers would you rather work with? The one with the lowly Rs. 910 LTV or the one with the stratospheric Rs.13,300? This is not a trick question.
Before we get carried away by the increasingly large numbers above, remember the LTV qualification. Bird in the bush, foggy, uncertain, inaccurate, promised land. They all still apply.
A business with higher contribution margin is better than one with a lower margin. Higher margins are difficult to defend unless you have managed to build a moat around your business and your customers.
The safest yet the most difficult way of doing that is by focusing on customer experience. World class service that makes your customers feel like a million dollars is the best way. It is expensive and rare but can be priced in your model.
It is better to build an organization driven by service quality from day one then to re-engineer one at the end of year two. Happy and satisfied customers not only come back with repeat orders, they also bring new customers with them to expose them to the experience.
Remember it is expensive to acquire a customer. It is a waste of resources to pick one who only buys once in his or her entire lifetime. Exceptions for big enough ticket sizes, maybe.
Customers who buy more and stay with you longer by buying every year are best. This is primarily trust economics and removing frictions in your conversion funnel. Identify these hurdles to conversion and eliminate them ruthlessly. Which means review purchase process and incentives.
Make it easier for customers to buy. Bring down the clicks required to checkout and complete your purchase.
Recommendations for Maya
Our recommendation for Altamash, Sabeen and Maya’s Closet are:
- Focus on increasing repeat orders from existing customers. Focus on converting single order customers into repeat customers.
- Explore adding higher margin items. Reduce number of clicks required for a customer to check out.
- Redesign advertising campaigns to increase repeat customers to increase CM and LTV per customer.
- Refocus the campaign to attract customer profiles that are likely to match the repeat buyer profiles.
- Start measuring and improving service quality and customer experience. Build a moat by making sure young mothers get evangelical about Maya’s closet.
- Existing customers have already crossed the trust threshold required to place an order. Their level of comfort with orders for higher value and higher margin items is already in place. It would be worth the price to run a small experiment to see if they are ready to convert to higher ticket sizes.
- Use growth capital to expand and serve repeat customers, not just any customer.
Scale economics and reality checks
Well that looked really good on paper. Does it work like that in real life?
There are additional applications of unit economics and complications. If it was just unit economics, we wouldn’t get it wrong and get into trouble so often. Unit economic curves shift as order volumes and capacity to serve them, move up and down.
A simple example from our friends at Maya will help illustrate. Please note that what follows is just a hypothetical case, not based on reality, exaggerated to make a few points. Altamash hasn’t mortgaged the family home. That is just me being melodramatic.
Maya discovers a new magic sauces that can increase conversion rate on ads and improve its yield to 5,000 orders per month from the original 500. In a moment of weakness, the founders decide to commit to the new model if they can figure out funding.
How does Maya scale to 4,500 order more than what it is currently processing? How much additional working capital does Maya need to finance additional orders? What else does Maya needs to scale?
At an average order size of Rs. 2,000, total expected sales proceeds are likely to be Rs. 9,000,000. Maya’s contribution margin is 35% which means it only needs to finance 65% of this amount. Maya needs to arrange Rs. 5.85 million per month in working capital to finance additional orders.
From the point inventory is ordered to the point payment is received from the cash on delivery couriers, Maya’s end to end inventory to cash cycle is 16 weeks. Maya is essentially out of cash for four months every cycle for every month of sales it processes. Total working capital requirements therefore jump to Rs. 23.4 million.
But Maya only has warehousing space that can cater to inventory for 1,000 orders a month. To store additional inventory Maya needs new warehouse space, it also needs additional support resources to book orders, respond to customer queries, package orders and ship them. A typical internal resource can pick, package and ship 40 orders a day. To ship 4,500 new orders a month, Maya need 5 additional service resources and a shift supervisor to manage them and ensure service quality levels stay above the defined standard.
They unfortunately don’t have the space in their home office to accommodate 6 more team members, so they need a new office, new computers, new desks and new chairs.
While the additional flow of orders is very welcome, unit economics have changed. To jump from 800 orders to 5,000 orders a month Maya needs to scale.
The new team, office and warehouse capacity adds an additional Rs.1,000,000 a month in fixed costs. This also includes new servers for processing the higher volume of orders since Maya can no longer maintain its order processing speed metrics with its new order volume on the old servers.
Higher conversion rates also lead to more expensive campaign and reach costs on FB and Google ad words, pushing advertising expenses to Rs. 500,000 per month. The new Customer acquisition cost CAC drops to 100 for each new customer from the original 350 but Maya needs to squeeze more cash from its limited resources to fund this amount.
Contribution margin improves to 50% but average order size slides to Rs. 1,500 which luckily changes the working capital requirements again. 50% * 5000 * 1500 is Rs. 3.75 million. Rs. 3.75 million times four months is Rs. 15 million, a significantly lower figure than our original Rs. 23 million estimate above.
The new contribution margin is now 750, slightly up from the original 700. The new breakeven point is 1,600 orders a month, up from the original 300. So even if order flow slides after the initial uptick, there is significant margin of safety for Maya to cover fixed costs under the new math.
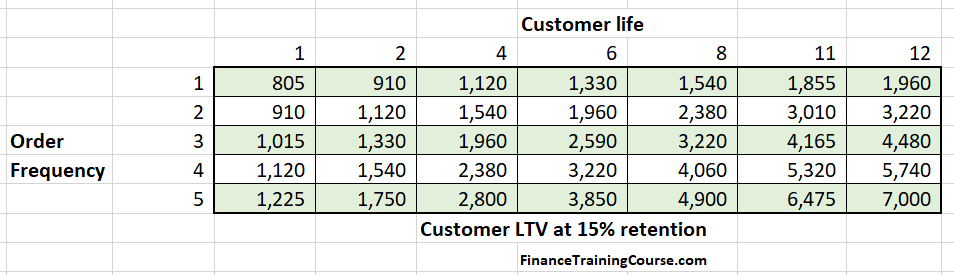
With the higher order levels, service quality levels drop significantly. Customer retention and repeat orders fall to 15% from 30% at lower levels. LTV falls from 5,320 to 3,010. (Can you do the math?)
But since the two founders are bright, intelligent, committed and hard working they figure it out, raise funding and re-launch under the new model. Given their track record they get a credit line from their banker backed by a mortgage on their family home. Using the revised unit economics above they estimate their cash flow needs to be four months of inventory (Rs. 15 million) and expenses (Rs. 6 million – 4 x 1 million + 4 x 0.5 million) for a total of Rs. 21 million. With the paperwork complete, their banker friend allocates the line for immediate use.
A year later their math is mostly right (off by about 35%) since they missed out a few big expense items they hadn’t budgeted and planned for. This leads to significant differences between their projected year end margin on shipping 60,000 orders a year and their actual realized margin on 60,000 orders.
The final tally of the shortfall as tabulated by their audit team is a deviation of 35% from projected financials. How in the world did that happen?
The first was interest expense on the credit line for 12 months. At 20% annually on the 21 million draw down, it sets them back by an additional Rs. 4.3 million a year. This was an oversight. It didn’t matter when Maya was borrowing from friends and family. But with banks involved, interest payments changed the unit economics.
Maya also didn’t factor in the impact of damaged and returned packages from customers and outright thefts on higher order volumes at the courier. The number was zero at 800 orders a month. It jumped to 10% at 5,000 orders a month. The 500 orders had to be reprocessed again and added Rs. 4.5 million a year on account of damaged, destroyed or stolen packages and Rs. 4.5 million a year for the cost of replacement goods to customers. The total amount was 9 million excluding the reprocessing costs.
The final hit was a cash on delivery courier default that went under while still owing Maya delivery proceeds from three months of sales.
Given that these hiccups didn’t hit Maya during its original smaller scale operations, the two founders were caught completely un-prepared by this fiasco. A 35% shrinkage from projected margins was unheard of in their prior careers in retail.
All this before the China crisis scenario. Maya’s Chinese supplier opens up shop in the local market and undercuts Maya prices by 35% for the same products. Leading to a price war which is great for young mothers, babies and dolphins, but terrible for Maya, Altamash and Sabeen. (Thank you Omer Ehtisham for suggesting this variation).
Welcome to scale economics. Unit economics on steroids that separates the men from the boys. Real life doesn’t follow models. Yet, models help test reactions and reaction speed to crisis. That training helps us respond faster to real fires, when they do occur.
Step up in processing, orders, volumes and bandwidth break the original unit economic equations. The models need to factor in the discontinuity on account of the scale driven step ups. Which is the reason why investor diligence teams use unit economics as one, but not the only factor on their checklist.
Unit economics and scale economics need to be modeled together, not in isolation. There is a complex dynamic dance between the two that creates complete chaos within the original model. Experienced founders and mentors call it the “go slow to go fast model”. Get the model right at lower volumes with fewer customers before engaging the warp drives.
It is the single biggest reason for founding teams to hit the wall and self-destruct as they grow beyond planned throughput and processing bandwidth.
Founder Puzzles
This article is a chapter extract from Founder Puzzles, Build better businesses right from the start, a new book on financial modeling for founders and startups by Jawwad Farid. Scheduled release date 31-Jul-2020.
Learn more about the book at https://bit.ly/FounderPuzzlesBook. Preorders open now at https://bit.ly/FounderPuzzles

Sources and References
- An interview with Jonathan Hsu from Tribe Capital, https://alexdanco.com/2019/07/14/an-interview-with-jonathan-hsu-from-tribe-capital/
- Diligence at Social Capital, https://medium.com/swlh/diligence-at-social-capital-part-3-cohorts-and-revenue-ltv-ab65a07464e1
- A quantitative approach to product market fit, https://tribecap.co/a-quantitative-approach-to-product-market-fit/
- https://medium.com/craft-ventures/the-gross-margin-problem-lessons-for-tech-enabled-startups-e2aefab8a0d4
- The Unit Economics of On-Demand Startups Explained by Adam Price, https://link.medium.com/uaNqKrpTG1
- https://medium.com/@MBGilroy/the-death-of-the-saas-ltv-cac-a5f48bde2878
- https://medium.com/gringottswizardingventures/the-ultimate-guide-to-vcs-ltv-cac-analysis-c74019ad72af
- https://medium.com/gringottswizardingventures/the-ultimate-guide-to-vcs-ltv-cac-analysis-pt-2-5ef0e3a3aefa
- https://growthbug.com/cohorts-to-ltv-cac-to-mau-tips-to-make-it-meaningful-avoid-vanity-dd8e91289900
- https://www.altexsoft.com/blog/business/unit-economics-striking-a-balance-between-customer-lifetime-value-and-acquisition-cost/
- https://www.toptal.com/finance/interim-cfos/unit-economics