It has been an interesting twelve months. Between bottoms, volatility, rumors and market shifts we have seen many interesting plays at work when it comes to trading crude oil. Depending on who you speak with, low crude oil prices and associated volatility has been the best gift 2015 brought with it or the worst crisis facing the Middle East today. Is the oil market really that easy to read?
What is driving this game? Is it a global geopolitical conspiracy with Russia, Iran and Saudi Arabia as unlikely bed fellows? A long overdue market driven correction that is finally here to stay? Or a complete breakdown of the decades old pricing mechanism that has set prices for oil for 40 years? Perhaps a combination of all three?
Within trading circles, volatility is great. It creates opportunities that would otherwise not present themselves. So traders we are always happy to see prices dancing every week in what would best be described as the yo yo formation. But before we go out and take those trading positions, is there a framework that will help wrap our heads around the oil problem. What is really driving this erratic price behavior? Where we hit a low every alternate week and jump up and down by 8% every alternate day? Are the inmates running the asylum?
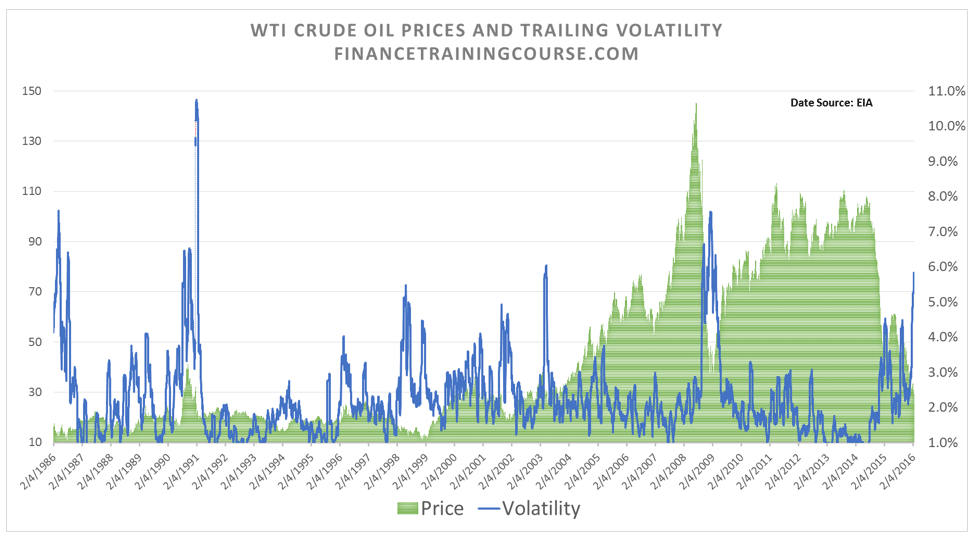
A thirty year review of oil price volatility indicates that while January and February 2016 have been volatile months they are still not comparable with 2009 thresholds. We have seen these levels in 1991, 1999 and 2003 but they are still lower than what the markets experienced in 1986, 1991 and 2009. Are the drivers for this surge in volatility the same?
To understand oil, you have to take a step back and look at multiple drivers. The drivers represent the framework. So when news break and markets move you have a better sense of how real or temporary the market’s reaction is. With the oil market the drivers are a combination of politics, historical context, macro economics, supply and demand and expectations of future price behavior. You have to model all of them, not just one.
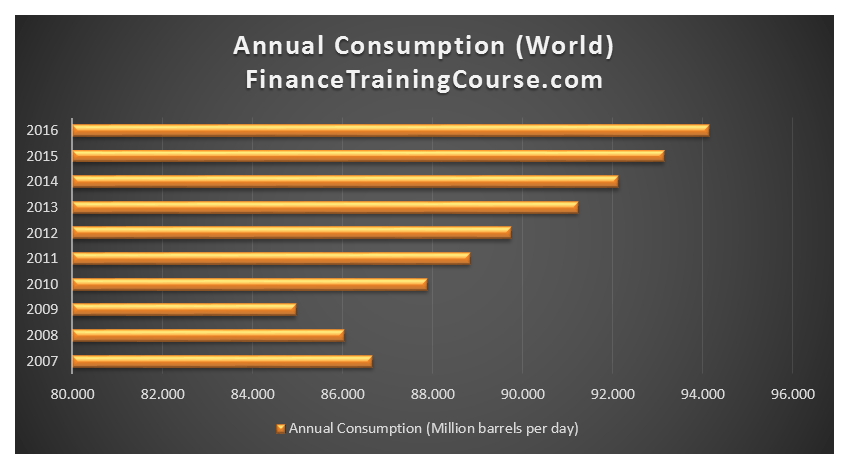
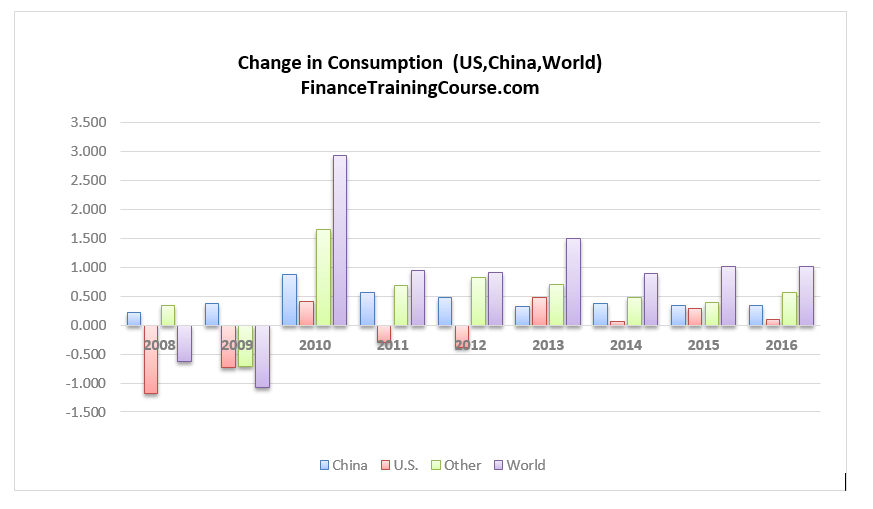
When it comes to politics, it was once enough to just look at the Middle East. Today you have to look at Russia, the Americas and the Middle East. The same holds true for production, demand and supply. On the demand side China drove commodity prices through the roof while the rest of the world was still reeling from the 2008 financial meltdown. The middle kingdom is now doing the opposite as it struggles with external pressures on the Yuan, internal challenges to financial stability and a dreaded economic slowdown. If this wasn’t enough macroeconomic context is distorting the picture in key producer economies.
We have been playing with and following oil since 2009 when wild gyrations in crude prices triggered political upheaval in many developing countries that were still subsidizing petrochemical products to a large population base. On the commercial side multiple airlines and couriers tried to hedge their jet fuel exposure given the double whammy of a global slow down and shrinking passenger miles. Every one in the supply chain from producers to consumers desperately searched for a solution because they were all exposed to this sudden, unanticipated rise in price volatility. What followed should politely be described as a bath. Not just for airlines but also for traders and many bystanders who designed structures that failed to hedge underlying exposures.
Within this context the question we have been asking ourselves for the last few months is: “Are we seeing a replay of 2008 and 2009?” Or has the world truly changed in some fundamental way? Are these low prices here to stay or are they going to take off tomorrow morning, leaving many of us wondering if we missed an opportunity to bank a fortune? More importantly did the price crisis from 7 years ago teach us something and can we put those lessons to work? Banking analysts and research reports are no help. Their most generous descriptor is that of a Flip flop switch – the same shops that were shouting hundred dollar oil in 2014 and early 2015 are now parading low teens as the new bottom. The more suave ones are betting on price ranges without realizing that the daily price volatility we have been witnessing can barrel through both upper and lower bounds in a few days if a trend takes hold and turns into direction.
So why not put together a series. Let’s take a look at data seriously and then decide if the game has changed. We no longer trade but we have managed to retain our curiosity. Hence the teaser. Let’s dissect oil markets once again and see what the fuss is all about. But rather than making trading calls, this time around we are more interested in asking the right questions. If we are lucky we will find answers. If not we can atleast identify the right data sets and sources to work with.
Here is the order and focus of our analysis.
Supply and Demand
Part I – China Crisis. Oil prices and the Chinese dragon roll.
Episode I. Storage, industrial growth, economic indicators and Chinese crude oil purchases. The equation has an interesting story to tell, especially in light of January 2016 numbers.
Part II – Russian roulette. Crude oil prices and the Siberian bear.
Episode II. Do the Russians have any incentives to cut or cap production? Are the Saudis willing to lend a helping hand?
Part III – The Kingdom of oil. Saudi Oil Strategy. How low can they go?
Episode III – The opinion on Saudi resilience is divided. What do the Saudi numbers suggest? How long will they be able to stand the current low price environment? What would Saudi macro indicators look like in 2017? Most importantly are the Saudis drifting with the crowd or are they following a plan? Can we guess?
Part IV – The Iran oil equation. Has spring really arrived in Tehran?
What does it really feel like being on the ground in Tehran. How much additional crude can Tehran bring to the table? What will that mean for crude oil prices? Take a look.
Part V – Doha and the oil output freeze conversation.
Will the April 17th Doha meeting between oil producers yield a result? What is really driving oil prices higher? Is the market pricing in a deal on output freeze or the renewed weakness in the US exchange rate behind the recent upward shift in prices.
Part Va – 5 Signals from Doha and Who will speak for the Kingdom?
What does the failure of Doha talks tells us? What do we know about His Highness Prince Mohammad bin Salman?
Price Modeling
Part VI – US Rig Count and Rig productivity
The Saudis have unwittingly created a monster. Linking US rig count, rig productivity and US oil production data together. Interesting relationship or paradox.
Part VII – Volatility – Are oil prices more volatile today?
When we look at crude oil prices, are oil markets more volatile today compared to 2008-2009? A quick look at the data from 2006 – 2016 across four different asset classes.
Part VIII – Correlations
Part IX – Signals – Putting it all together
Depending on which side of the bed I get off from during the next week and the effectiveness of the flu vaccine, you will see an episode as early as tomorrow morning and as late as the end of the month. The last time I traded oil, it wiped me out, so this time I have no positions or views. Just intellectual curiosity. It would be interesting to find if there really is a play here or are we just all passengers drifting together on a wild ride.
Feel free to chime in and say your piece. I have always loved an audience. Ciao.
Comments are closed.