This weekend I sat down and tabulated the amount we spent on energy as a family of eight every month. The answer surprised me.
37 percent of our household budget was spent on fuel, electricity, natural gas and transportation bills. When we accounted for seasonal adjustments (no air-conditioning in winter months) the amount dropped to 35% for the full year. A crude estimate worthy of a failing grade from my economics professor yet close enough for me to sit up and take notice.
A twenty percent drop in oil prices or an equivalent reduction in our monthly energy budget over a year would put two thousand dollars in savings in our bank account. Twenty thousand dollars over a decade. I know I am getting ahead of myself but that is real money for someone with my middle class roots.
Was there anything I could have done different to save this amount? There are thirteen single family homes in our lane in the immediate neighborhood. While usage would vary across families, the relative size of savings would be similar since our demographics are comparable. Scaled across other middle class households in Karachi, the city I live in, the math quickly became interesting.
Before math, a lesson in history.
In 1986 crude oil prices collapsed to 12 dollars a barrel. Two years later a democratically elected government sat down to decide Pakistan’s energy policy. Given where oil prices were (relatively cheap) at that point, they opted to go with furnace oil to power the energy grid for the next thirty years. While the final energy policy was rolled out in 1994, that one directional decision in 1988 sealed the fate of our nation by changing the competitive profile of our industrial base, our import bill and subsequently our trade balance.
Given the data in front of them at that point, it wasn’t a terrible call. They got the short term outlook right. As long as you ignored the 30% to 50% variation in budgeted prices witnessed over the next ten years (1988 to 1998). Then error margins became unforgivable.
The long term outlook on oil prices in the energy policy was off. Not by a paltry 100% but orders of magnitude wrong. An understandable human error, perhaps with no malicious intent given how our world changed in those ten years. Yet catastrophic when we add damages across time, industrial base and households.
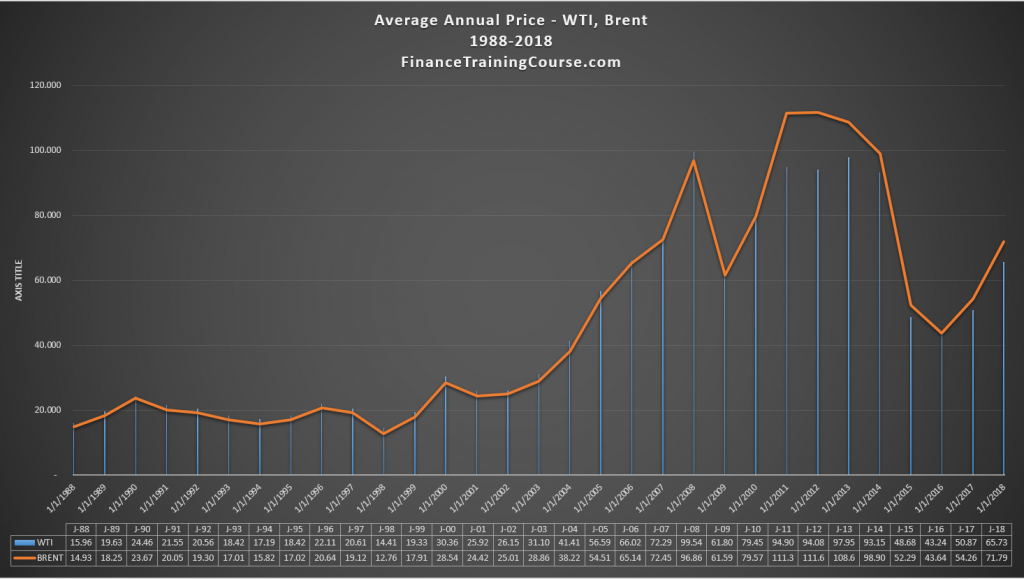
Figure 1. A plot of annual average crude oil prices from 1988 to 2018. Three clear periods. Low prices from 1988 to 2003. Rising prices from 2004 to 2013. Price decline from 2015-2017. Question to ask after 2018 – Will we see a repeat of low prices or high?
The point. One decision linked to a tardy forecast got us to where we are today. Oil prices? Were they really that difficult to predict? My interest was piqued. I was hooked. 32 years later could I do a better job than energy policy wonks who owe me and my poor father twenty thousand dollars each?
Modeling energy markets is complicated. Why do qualified professionals who attempt to take on this task get it wrong?
We take a deep dive to understand the reasons behind the wild swing in crude oil prices. From EIA updates to OPEC monthly outlook, from clean nuclear reactor designs to shale oil, from rising paper trading volumes to growth outlook in Africa, we examine data sources and opinions to see if we should be worried about the world running out of oil in our life time.
In our search for answers we run into interesting questions.
Did the Saudis declare war on shale in 2014? Are they like to do the same in 2019? Will we see a functional fusion power plant in the next 5 or 10 years? Or will fusion remain within the realm of science fiction? How much crude does the world consume in a given day? How much do we produce? Are electrical vehicles going to take over the world? When they do what happens to big oil? How many years of oil do we actually have? How good a job energy policy wonks do? Why is there so much conflict and contradiction in opinions about oil prices?
Can we find credible data to answer these questions? We try. 6 weeks, 32 pages, 21 years of data. It took that long to track real insights and get straight answers. We have no positions to trade, commissions to earn or toys to sell. Just good old curiosity and a desire to figure out what makes the world of oil go around. Not investment or trading advice but material for intelligent conversations.
A word of fair warning. This isn’t your normal news article or a traditional long form piece. When we say deep dive, we mean every single word of it. All 9,998 of them. Grab a cup of coffee, lean back and enjoy the ride. This is going to take a while.
Our brand new series on crude oil has been broken down in five parts. If you would like an easier to read, printable, PDF edition, drop us a note and we will put it up here over the next few days and let you know when its done.
- Part I – A model for crude oil prices.
- Part II – Modeling demand for liquid fuels in 2019
- Part III – Supply side questions for crude oil in 2019
- Part IV – Crude oil price directions – Market and signals in the data.
- Part V – Oil market time machine. Past, present and future.
Primary data sources and references
- The Energy Information Administration (EIA) short term energy outlook, 15 January 2019.
- The Energy Information Administration (EIA) annual energy outlook, 2018.
- BP Statistical review of world energy, June 2018.
- Federal Reserve Bank of Dallas, Energy Charts, 3 January 2019.
- OPEC, Monthly Oil Market Report, December 2018.
- US Oil rig count, Baker Hughes via Quandl and Dallas Fed.
- Price series, Quandl and Federal Reserve Bank of St. Louis.